
The DynPEQ user interface contains dynamic elements to provide you with its processing status. This allows you to visually assess how DynPEQ operates and reinforce the action the dynamic equalizer is taking as you listen.
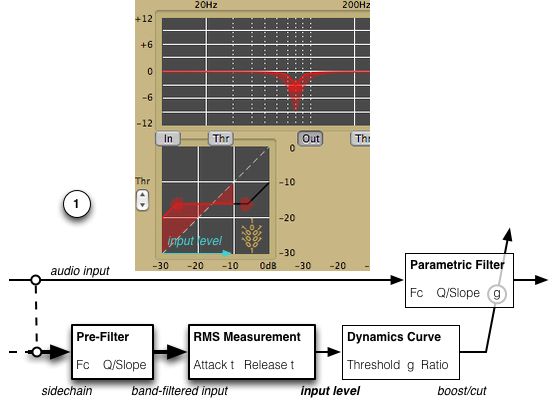
We will take the processor diagram from the DynPEQ band page and show where UI feedback elements tap into the data flow.
(1) DynPEQ measures the total RMS energy from the core filtered sidechain signal. The sidechain level becomes the value on the x axis that is mapped to the dynamics curve. The point where the dynamics curve is applied is the end of the solid color line (solid red here). The shaded color area illustrates the offset from the dynamics curve to the line of neutral gain.
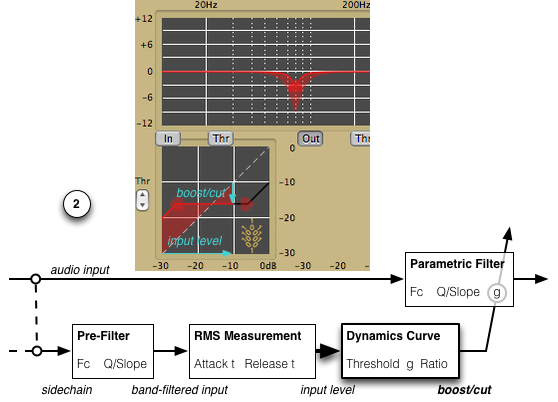
(2) The offset from the line of neutral gain–the diagonal dashed line–to the dynamics curve point at the current level becomes the effective boost/cut at this moment.
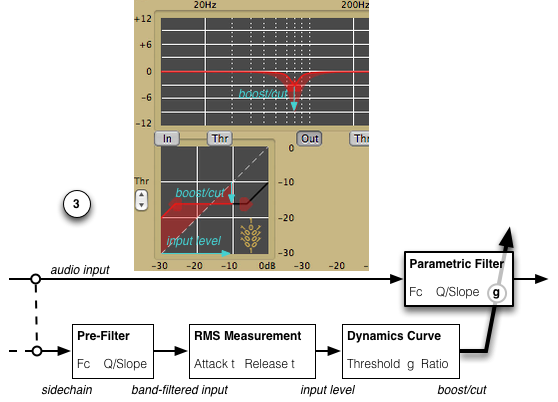
(3) The dynamic boost/cut signal from the dynamics curve is offset from the static parametric filter boost/cut. The static parametric setting is represented by the solid color line, and the offset response lies on the edge of the shaded color area connected to the static response.
Video: for more information on DynPEQ band processing and the plugin UI, see the video through this link.
